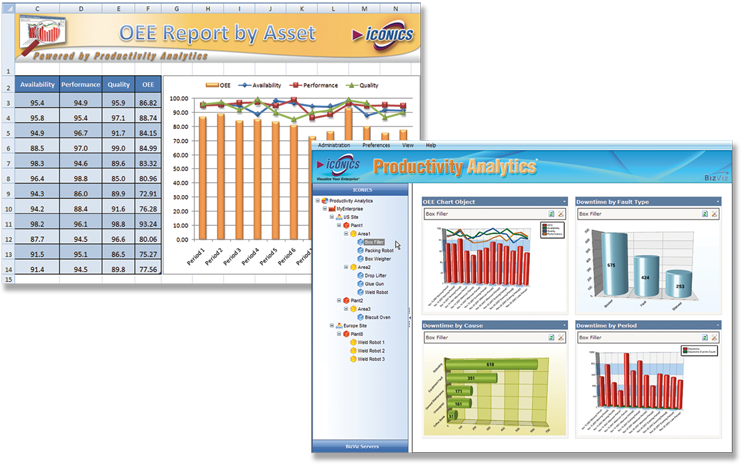
Visual OEE, KPIs and Analysis for Operational Excellence

Productivity Analytics™ continuously calculates and delivers real-time OEE and other important KPIs to anyone in the organization using Microsoft Internet Explorer. Accurately deliver plant specific KPIs and rich visual charts and reports to display OEE, Cycle Time, MTBF, TAKT time, Efficiency and Throughput.
- Improve Quality and Reduce Equipment Downtime
- Quickly Identify Performance Issues and Take Action
- OEE and Executive Dashboards with Real-time Analytics
- Standard OEE and Lean Manufacturing Reports
